Welcome to the Math page!
This page will show the projects I have done throughout the year in math.
Graphing 101
This project was the first from our Algebra class. Sorry about the blur on the 4th picture
D.L.I.Q.C.
I recreated the keynote i created in the beginning of the year about graphing functions. I learned what is and what isn't a function. It was interesting how if one number outputs 2 different numbers, then the whole function is false. Why would this be important to real life? I can connect this to lessons I learned during seventh grade.
Concert
To demonstrate how good we were with functions, we had to create a concert scenario and find out how many people would have to attend in order to get our money back. Yes, Mine was about Skrillex. I hate dupstep now.
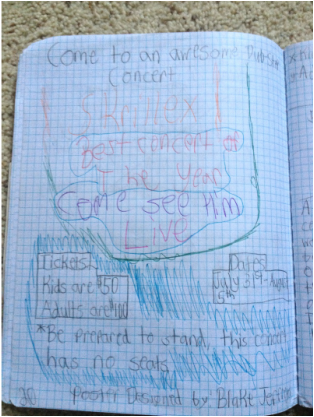
D.L.I.Q.C.
We created a poster advertising a concert and created a problem to see how many tickets we would need to sell to break even. I learned how to calculate break even problems if I were ever to work a concert. It was interesting how easy this concept was even though I didn't understand it at first. No questions. I can connect this to real concerts and how they calculate if they break even or not.
Solar Slopes
This assignment was used to discover the slope planets rotate on. I was not very good at this.
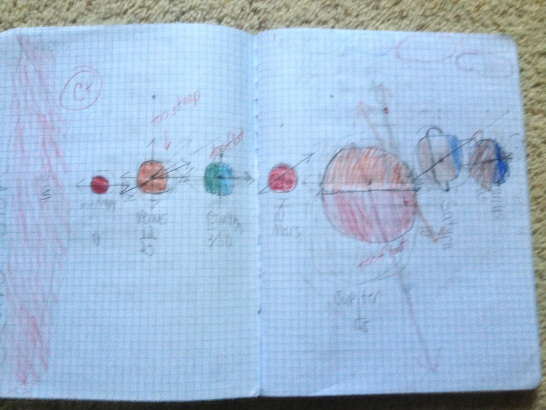
D.L.I.Q.C.
We graphed the axis of the planets in Solar System. I learned how to graph slope using fractions. It was interesting how one miscount could mess up the whole axis. Why do most planets rotate on such a weird axis. I can connect this to the actual solar system and how these planets rotate.
Polynomial Building
Around the end of second quarter, we had to design a building with at least twenty rectangles and twenty triangles. Then we had to do some stuff in order to find size, and area. Then we scaled it and created it. Mine was tiny.
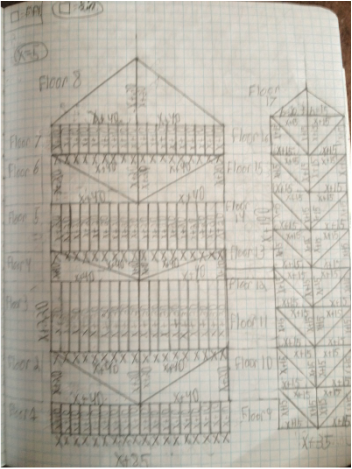
D.L.I.Q.C.
We created a building in minuscule and then enlarged it (but the enlarged models were all thrown away so you're just going to have to look at the rough draft.) I learned how to find area of buildings and how to enlarge this. Why would one need to find the area of each shape on the building? I can connect this to the drawing enlargement we did later in the year.
Rainbow Parabolas
This St. Patrick's day graphing project was used to teach us about graphing parabolas. As you can clearly see, I'm not very good at this.
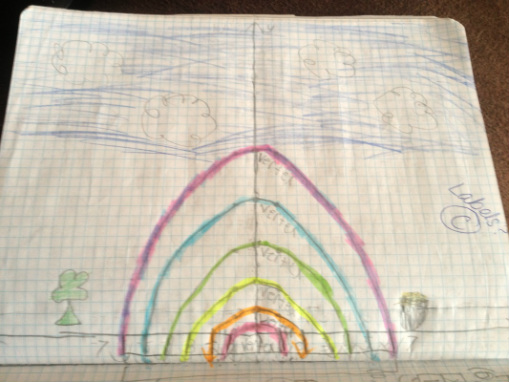
D.L.I.Q.C.
We created a parabola rainbow using math. I learned how to graph polynomials and label them. It was interesting how the parabola, if graphed wrong could make you start all over again. What labels do you think I was missing? I can connect this to a roller coaster is pre-production, they have to graph it out using this type of algebra.
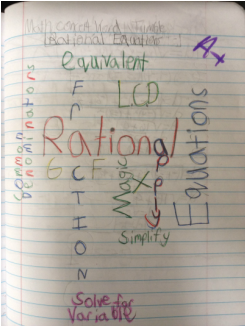
Math Wordle
The Wordle is a collage of words in different sizes, fonts, and colors to describe a certain topic. The purpose was to renew our brains on a certain topic. Mine was rational equations. Below is a copy of the drawing. I have really bad handwriting.
D.L.I.Q.C.
We did this project in order to refresh our memory on a forgotten topic. We relearned what topic we chose to create wordles on. I found it interesting how difficult such an easy assignment could be. I don't have any questions. There are no connections I can make.
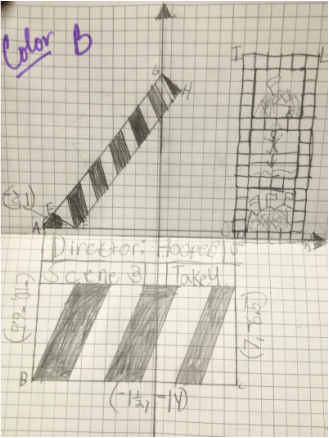
Graph Art
Another project of ours was to create an image relating to the arts using about twenty lines. Since I love cinematography, that was what mine was about. I created a marker that says Director, Scene, and Take. And a film roll depicting scenes from Les Miserables. As you can clearly see, I got a B.
D.L.I.Q.C.
We did this so we could be experienced in working backwards from plotting to finding the point of intersections. I learned to make pictures using lines and applying math. I found it interesting how we could relate this to the arts that we are passionate about. I don't have any questions about this topic, I thought it was easy. I connected this picture to my favorite movie.
